 |
|
| Mobile-sized | ||
| This site: | ||
| Home | ||
| Copyright | ||
| Let the Devil Wear Black: | ||
| Briefly. | ||
| ||
| Additional Resources... | ||
| James Linden: | ||
| Background | ||
| Contact | ||
Resources - Magic Eye
A look at Auto-Stereogrammes.
Chapter 7
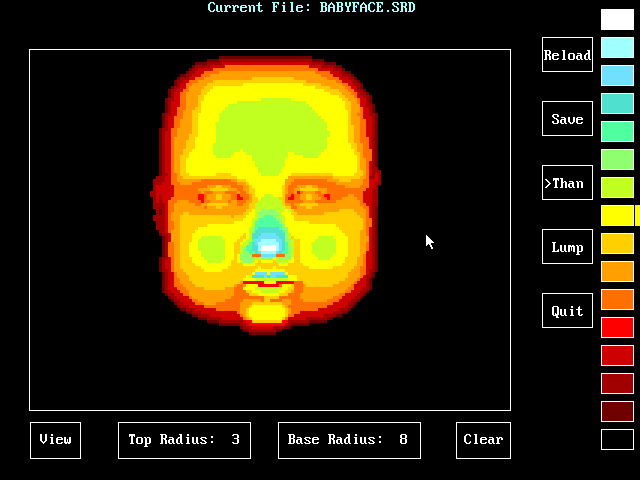
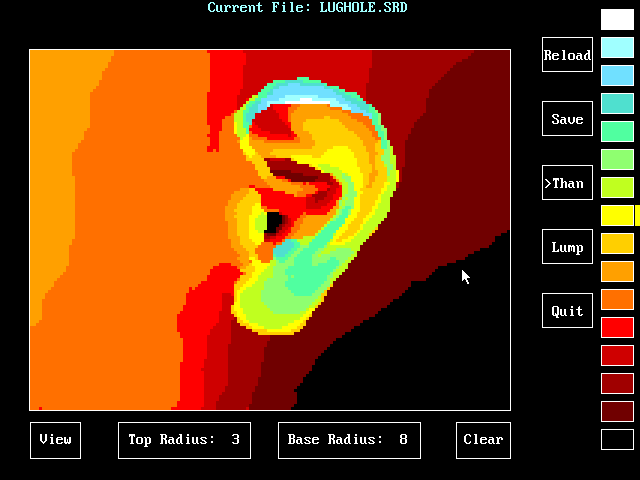
'AutoStereogrammes', also known as 'Single-Image, Random-Dot Stereogrammes' or 'SIRDS' are images that contain 3-Dimensional information in a very high density, allowing them to be used in applications such as mapping and so on - all of the images below the top one are from the program that ended up in the magazine that precipitated the incident on the 8th August 1994.
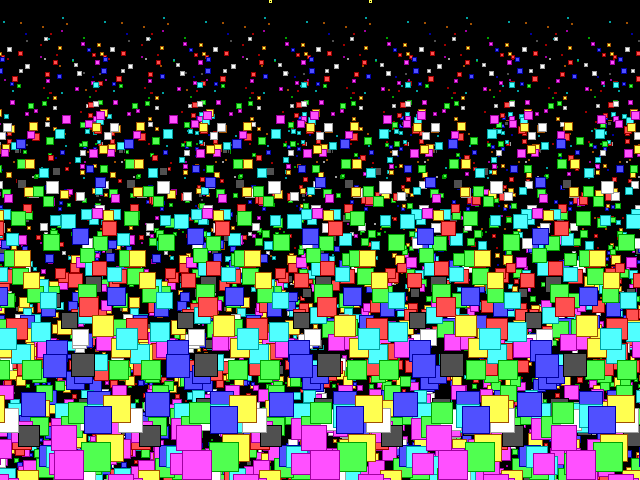
The first image is from a proof-of-concept program that I wrote, just to test out the idea of having 3D information in one image, just by repeating a particular shape across the screen.
If you look at the small cyan-coloured square towards the top of the image - there are two that are repeated, just pick one of them - and count how many there are across the screen, you will see that there are six of them. If you count the lowermost blue squares, you will see that in the same distance, they repeat only five times. This is because the larger squares need to appear at a different distance away from you than the smaller squares - the different pitch giving the illusion of depth when you cross your eyes.
So, how much do you need to cross your eyes? At the top of each of the 3D images on this page, you will see a pair of small squares close to the centre of the image. If you cross your eyes so that the two dots superimpose, your eyes will have the correct amount of convergence - all you have to do is make your eyes focus in this unnatural configuration.
With your eyes crossed, you should now see that the squares form a 3D field with the smaller ones further away and where there is image overlap, the one in front covers the one at the back.
That is just a test image with some large, easy-to-see squares on it. The fun starts when you change the squares for dots and start putting some high-density information in the image. So, how is that done? The illusion of some squares being further away is caused by the gap between the squares - here it is constant but if you change the pitch as you go across the image, according to a height map, you can create contours.
Below are some examples of the SIRDS output.
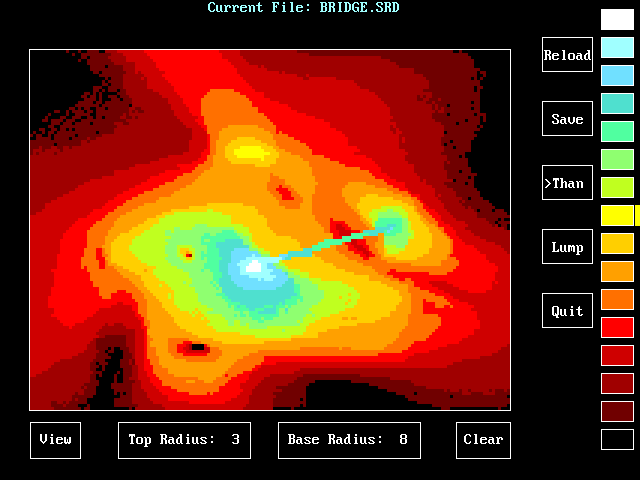
This is an example of a map - here literally a map of an imaginary island with a suspension bridge between two peaks. The image is from the program's editor and you can see the height represented by different colours with a walkway between the two describing a catenary.
If we start at some random point and then travel to the right by the distance between the two points that are displayed at the top of the SIRDS image, plus an additional amount based upon the height of the contour for the new point, we get the position for the new dot so we plot that and repeat the process until we get to the other side of the display.
We then repeat that up and down the screen until there are enough dots to see the image. If there are too many dots, they will blend into each other and the image will be degraded so instead, we can use coloured dots to achieve a higher dot density for a higher data density before the image starts to degrade.
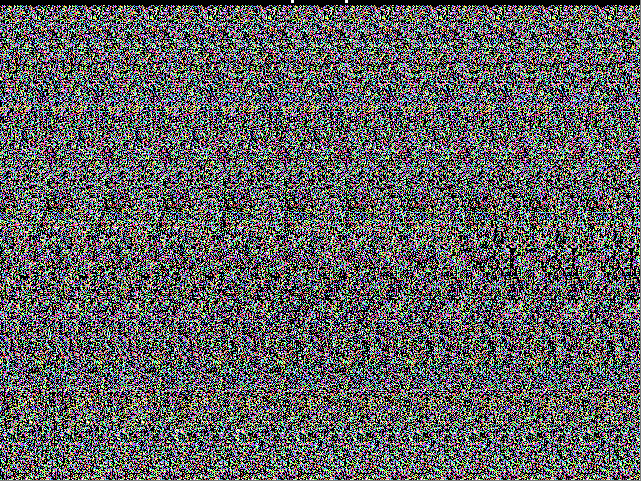
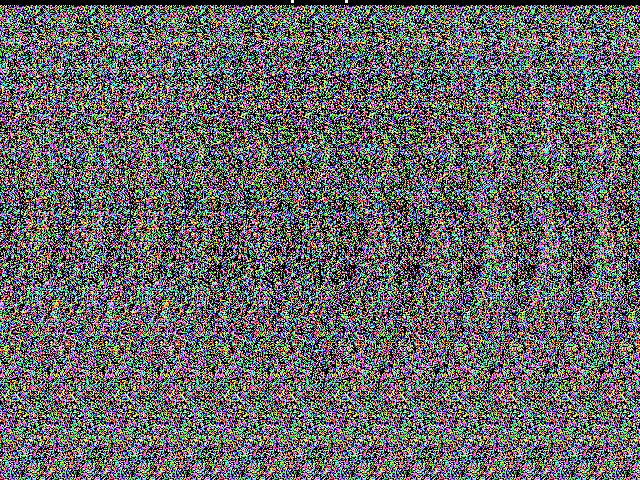
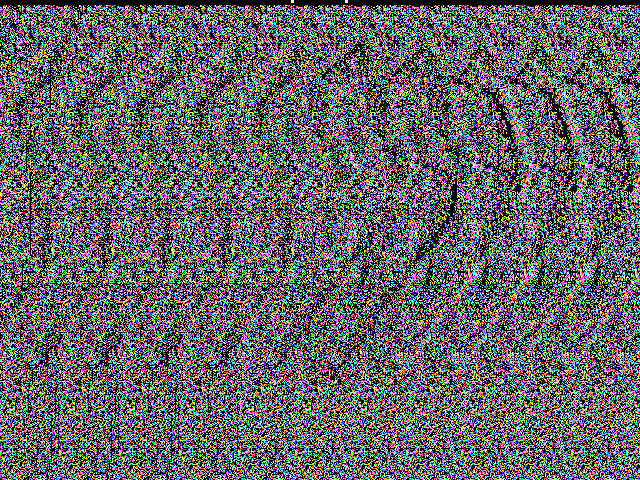
Here, you can see the SIRDS image that it produces. Take your time and you will see it. Below are two more SIRDS images with their maps, displayed the other way around so as you scroll down this page, you will encounter the SIRDS first so you can look at it and try to work out what it is before revealing the mapping image.
Have fun...
Not too far...
and,
Not too far...
With it were copies of evidence supplied by their own solicitors...
